In 2023, solar photovoltaics (PV) capacity grew by 32.59%, making it the fastest-growing renewable energy technology globally.
Why Is Solar PV Leading the Pack?
Solar PV has posted remarkable year-over-year (YoY) capacity growth rates of 20.07% in 2021, 23.14% in 2022, and now 32.59% in 2023. Although offshore wind soared with a 57.87% jump in 2021, solar PV took the lead from 2022 onward. According to the International Energy Agency (IEA), solar made up roughly 70% of the total increase in renewable electricity generation in 2023. The sector’s surge can be attributed to:
- Falling costs of solar modules and balance-of-system components
- Supportive policies and incentives in key markets (e.g., feed-in tariffs, tax credits)
- Rapid technological improvements boosting panel efficiency
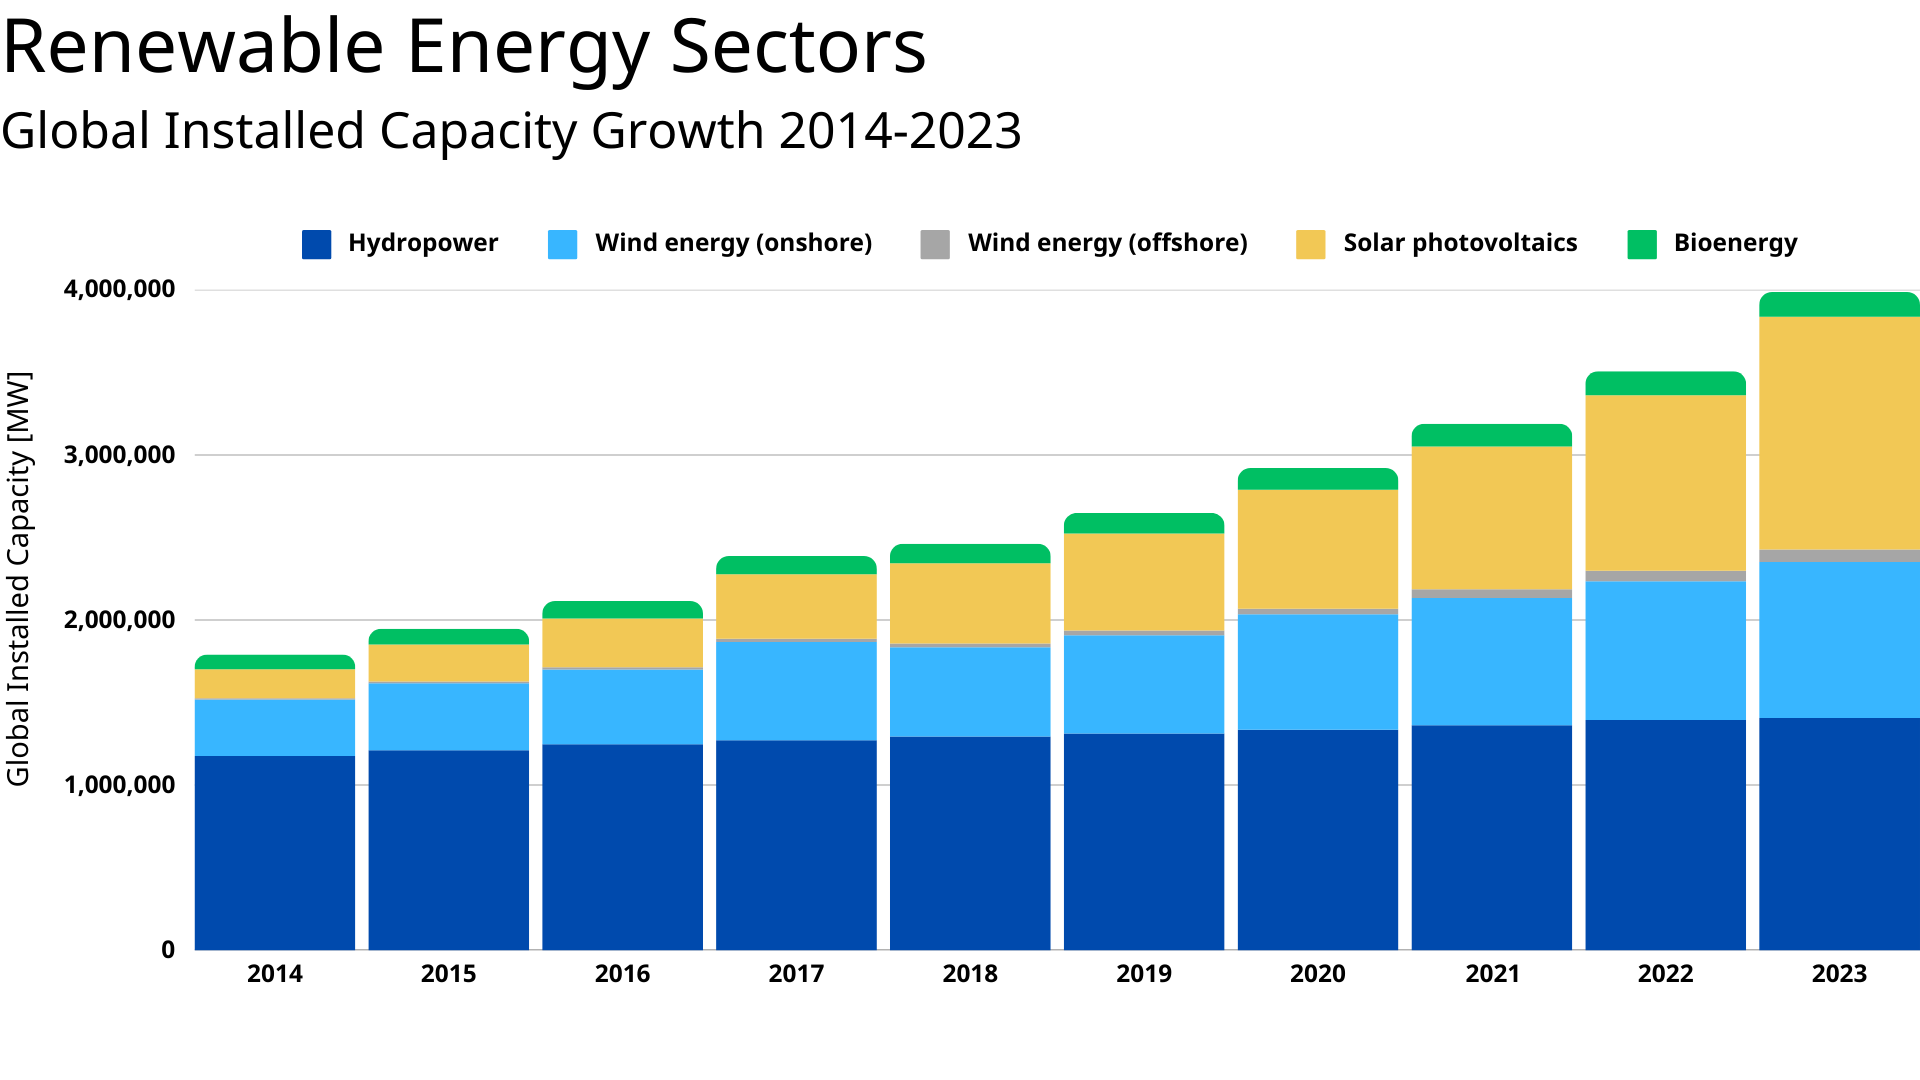 ▲ Fig 1 - Global Installed Capacity of Renewable Energy by Sector, 2014-2023. Source: IRENA
Solar made up roughly 70% of the total increase in renewable electricity generation in 2023.
Annual Capacity Growth (MW)
Below is a snapshot of how quickly different renewable energy sectors expanded in their installed capacity. Notice the exceptional spikes in offshore wind in 2021 and solar PV in 2022–2023:
| Sector | 2021 | 2022 | 2023 |
|---|---|---|---|
| Hydropower | 2.04% | 2.38% | 0.86% |
| Marine energy | -0.20% | 0.40% | 0.40% |
| Wind energy (onshore) | 10.15% | 9.12% | 12.37% |
| Wind energy (offshore) | 57.87% | 15.34% | 20.10% |
| Solar photovoltaics | 20.07% | 23.14% | 32.59% |
| Concentrated solar power | -0.61% | 3.12% | 4.56% |
| Bioenergy | 4.79% | 4.30% | 3.16% |
| Geothermal energy | 1.94% | 1.53% | 2.55% |
▲ Table 1 - Annual Capacity Growth of Renewable Energy Sectors, 2021-2023. Source: IRENA
Does Solar Dominate in All Major Regions?
Solar is on the rise worldwide, but the pace of growth differs by region:
- China stands out with the largest installed capacity, soaring from the low 200s (GW) in 2019 to well over 600 GW in 2023. This reflects China’s massive manufacturing capabilities and national-level support for renewables.
- The EU nearly tripled its solar capacity over the same period, driven by robust climate policies and member-state commitments to clean energy targets.
- In the USA, solar capacity roughly doubled amid continued federal tax incentives and strong private-sector investments.
- Japan, India, Brazil, and Australia each show steady gains from smaller bases, with Brazil in particular posting dramatic year-over-year jumps. Diverse economic contexts are embracing solar PV at unprecedented rates. China and the EU currently lead in sheer volume, while growth trajectories in places like Brazil and India suggest that solar may continue spreading across the globe at increasing speeds.
Learn more about Global Hotspots of Renewable Energy.
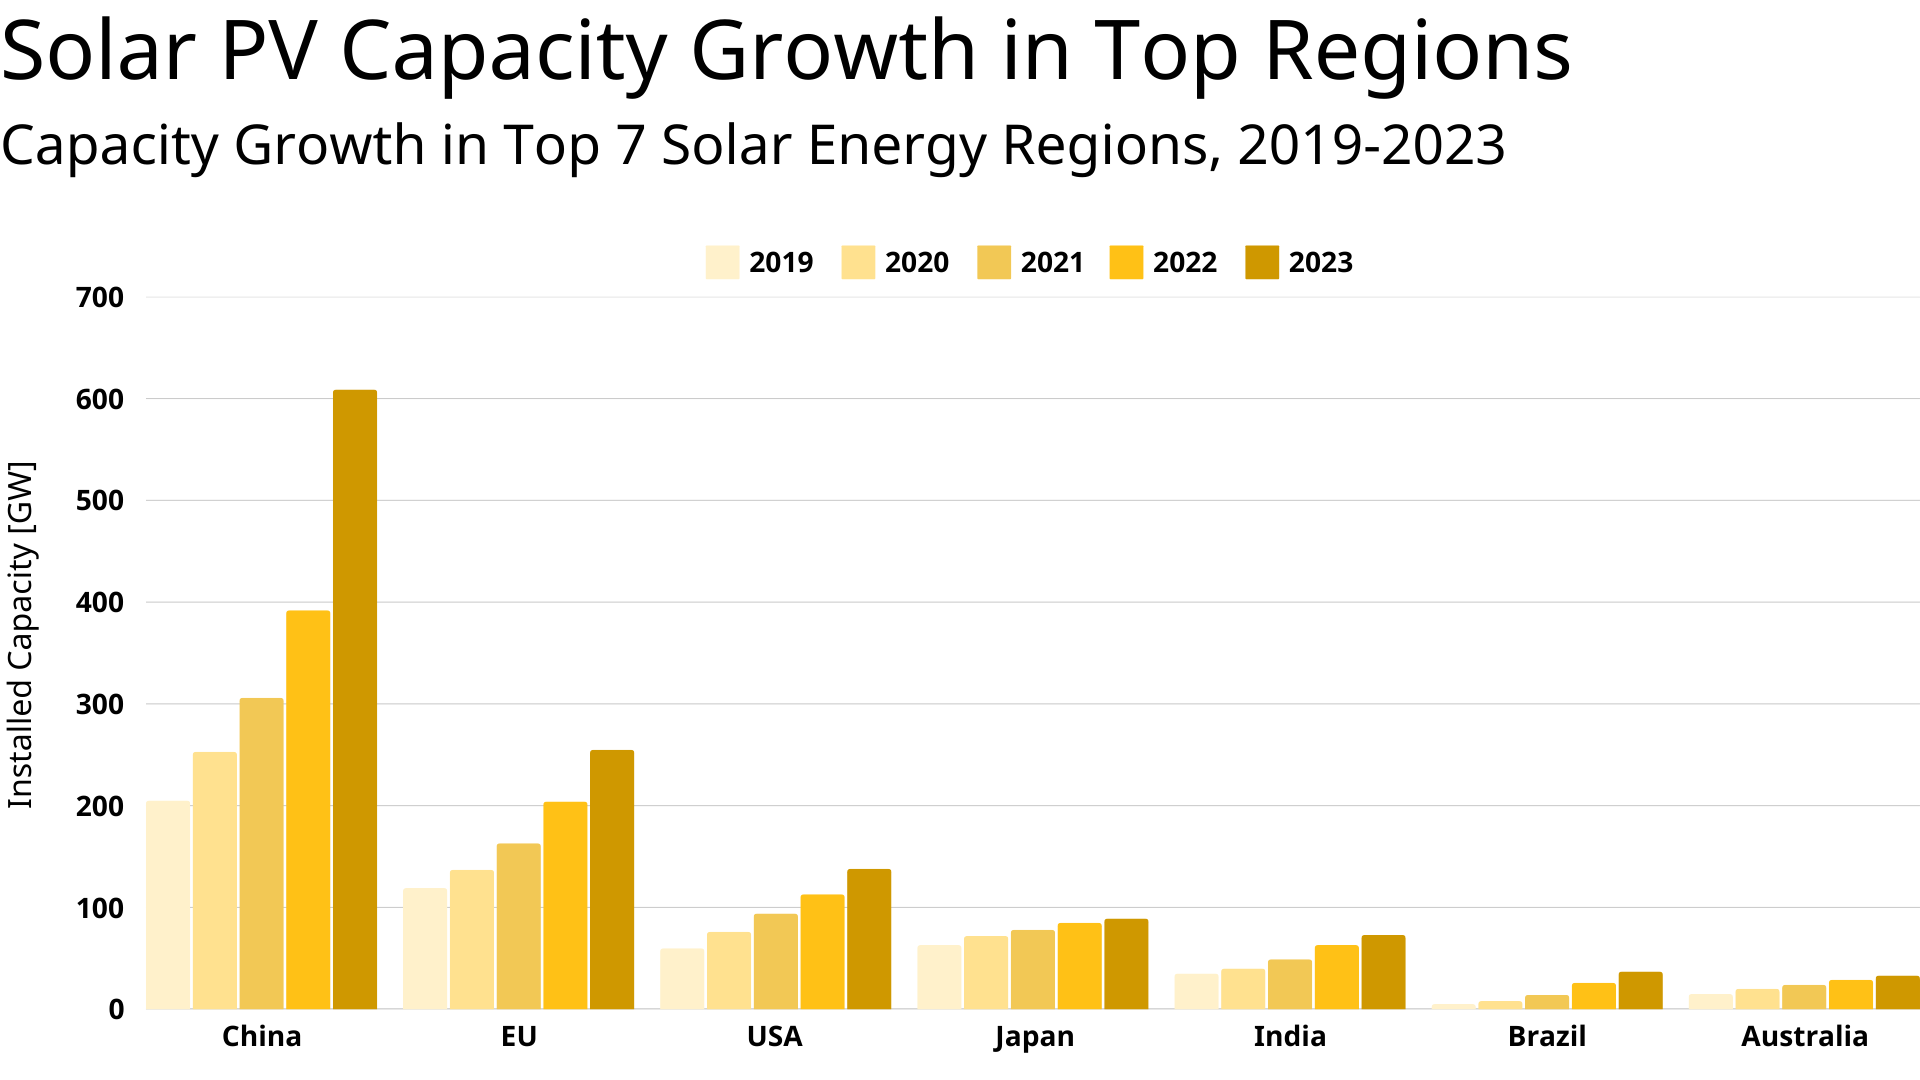 ▲ Fig 2 - Solar PV Growth in Top Regions - Capacity Growth in Top 7 Solar Energy Regions, 2019-2023. Source: IRENA
Annual Generation Growth: Solar and Wind
While solar PV leads in capacity expansions, wind has had impressive gains in electricity output. This difference is largely driven by wind’s higher capacity factor, particularly offshore, where more consistent wind speeds translate into steadier, higher-volume power generation. In other words, even with fewer MW of new installations, wind farms—especially offshore—often produce more GWh because they can run closer to their maximum rated output for a greater percentage of time. Offshore wind, in particular, recorded a 22.97% increase in 2020 and an even more robust 32.27% in 2021. By 2022, however, solar PV surpassed wind in generation growth as well, achieving a 26.04% jump in output.
Offshore wind recorded a 22.97% increase in electricity generation in 2020 and an even more robust 32.27% increase in 2021.
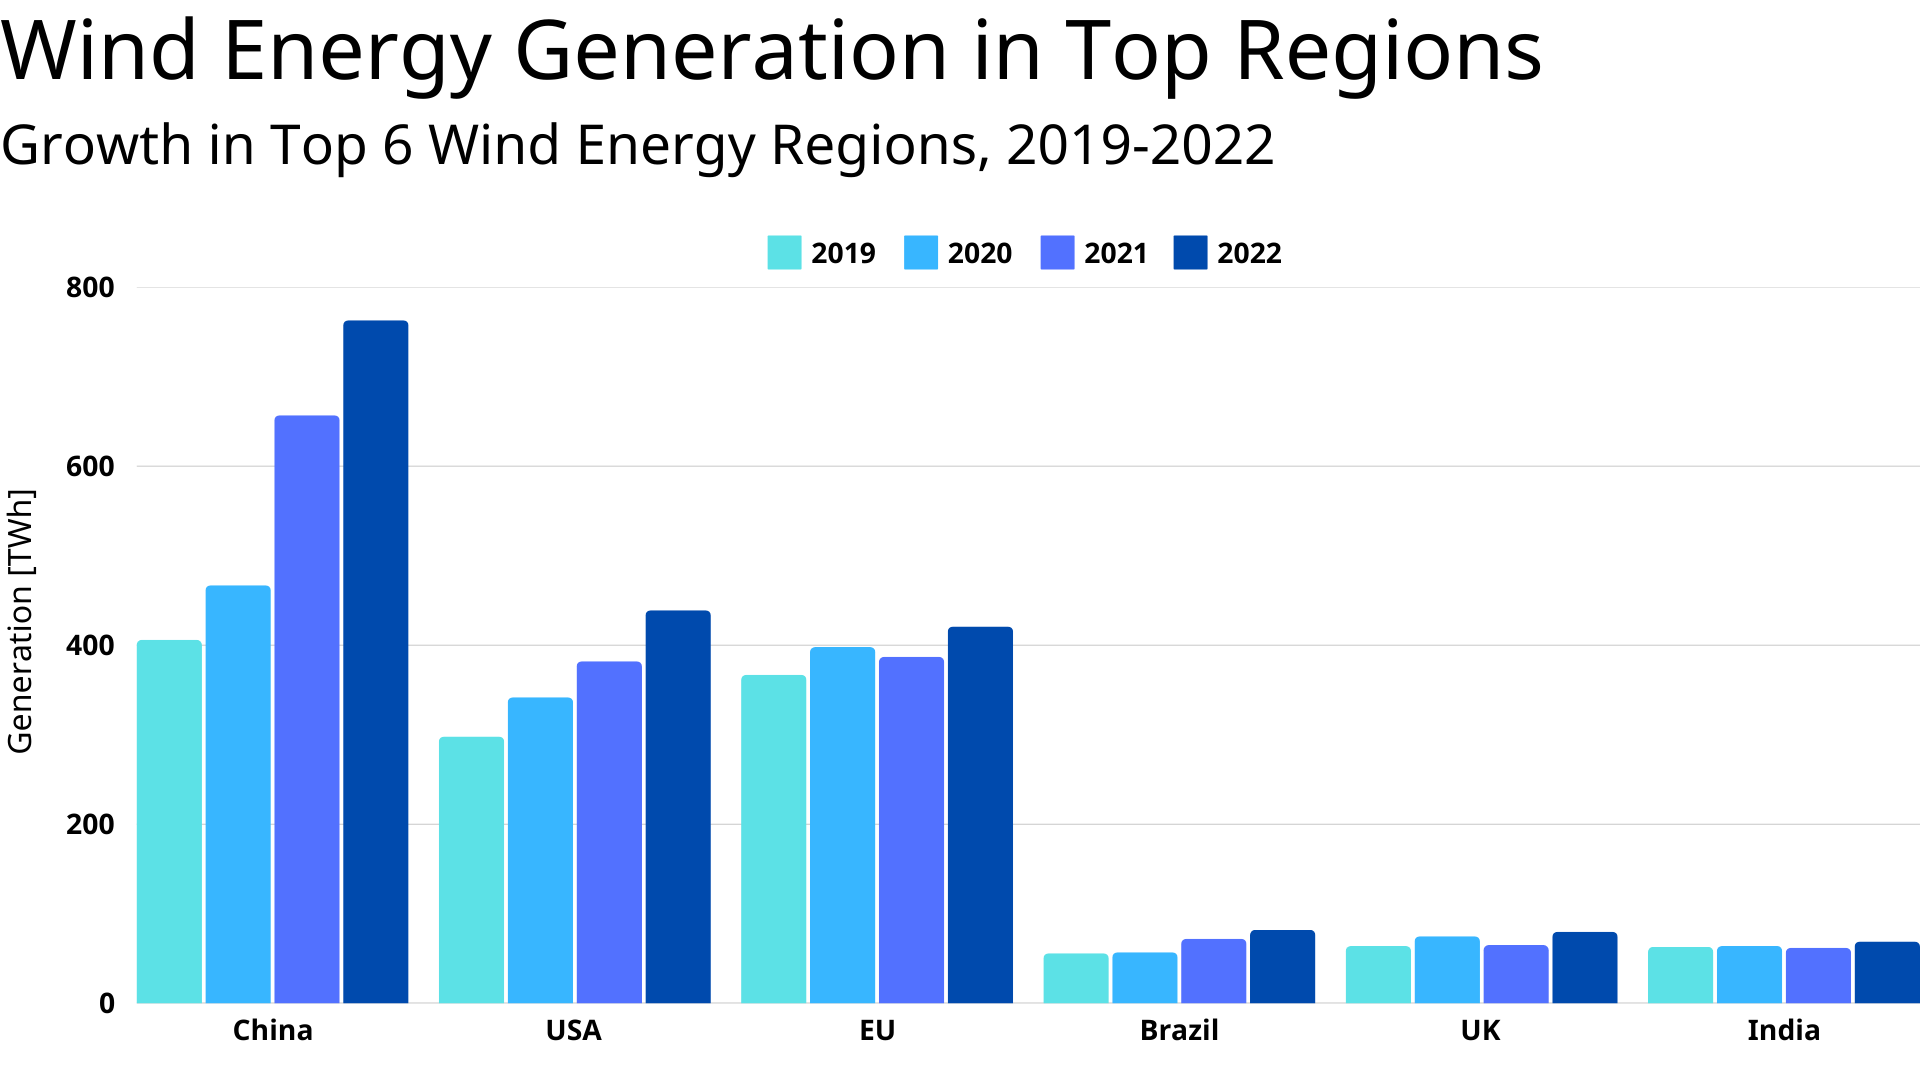 ▲ Fig 3 - Wind Energy Generation in Top Regions - Growth in Top 6 Wind Energy Regions, 2019-2022. Source: IRENA
Below is a table illustrating which renewable technology grew fastest in terms of electricity generation (TWh) between 2020–2022:
| Sector | 2020 | 2021 | 2022 |
|---|---|---|---|
| Hydropower | 2.78% | -1.52% | 1.14% |
| Marine energy | -1.10% | -1.42% | -1.44% |
| Wind energy (onshore) | 11.77% | 14.72% | 13.72% |
| Wind energy (offshore) | 22.97% | 32.27% | 17.64% |
| Solar photovoltaics | 21.71% | 23.63% | 26.04% |
| Concentrated solar power | -6.69% | 3.81% | -6.17% |
| Bioenergy | 0.62% | 11.12% | 1.54% |
| Geothermal energy | 3.74% | -0.83% | 2.35% |
▲ Table 2 - Annual Renewable Energy Generation Growth, Sectors, 2020-2022
Job Creation: Where Are Opportunities Growing Fastest?
According to the International Renewable Energy Agency (IRENA), the solar sector has been consistently adding a large share of new jobs, reflecting its rapid capacity growth.
- Solar PV creates an ongoing high demand for installation technicians, maintenance personnel, engineering, and manufacturing roles. Learn about the different types of jobs in the solar energy value chain in our article Career Opportunities in Solar Energy.
- Wind Energy: Continued expansion offshore is driving significant needs for marine construction, turbine assembly, and maintenance professionals.
- Other Renewables: Hydropower, bioenergy, and geothermal see more steady job additions but less dramatic spikes in demand year-to-year.
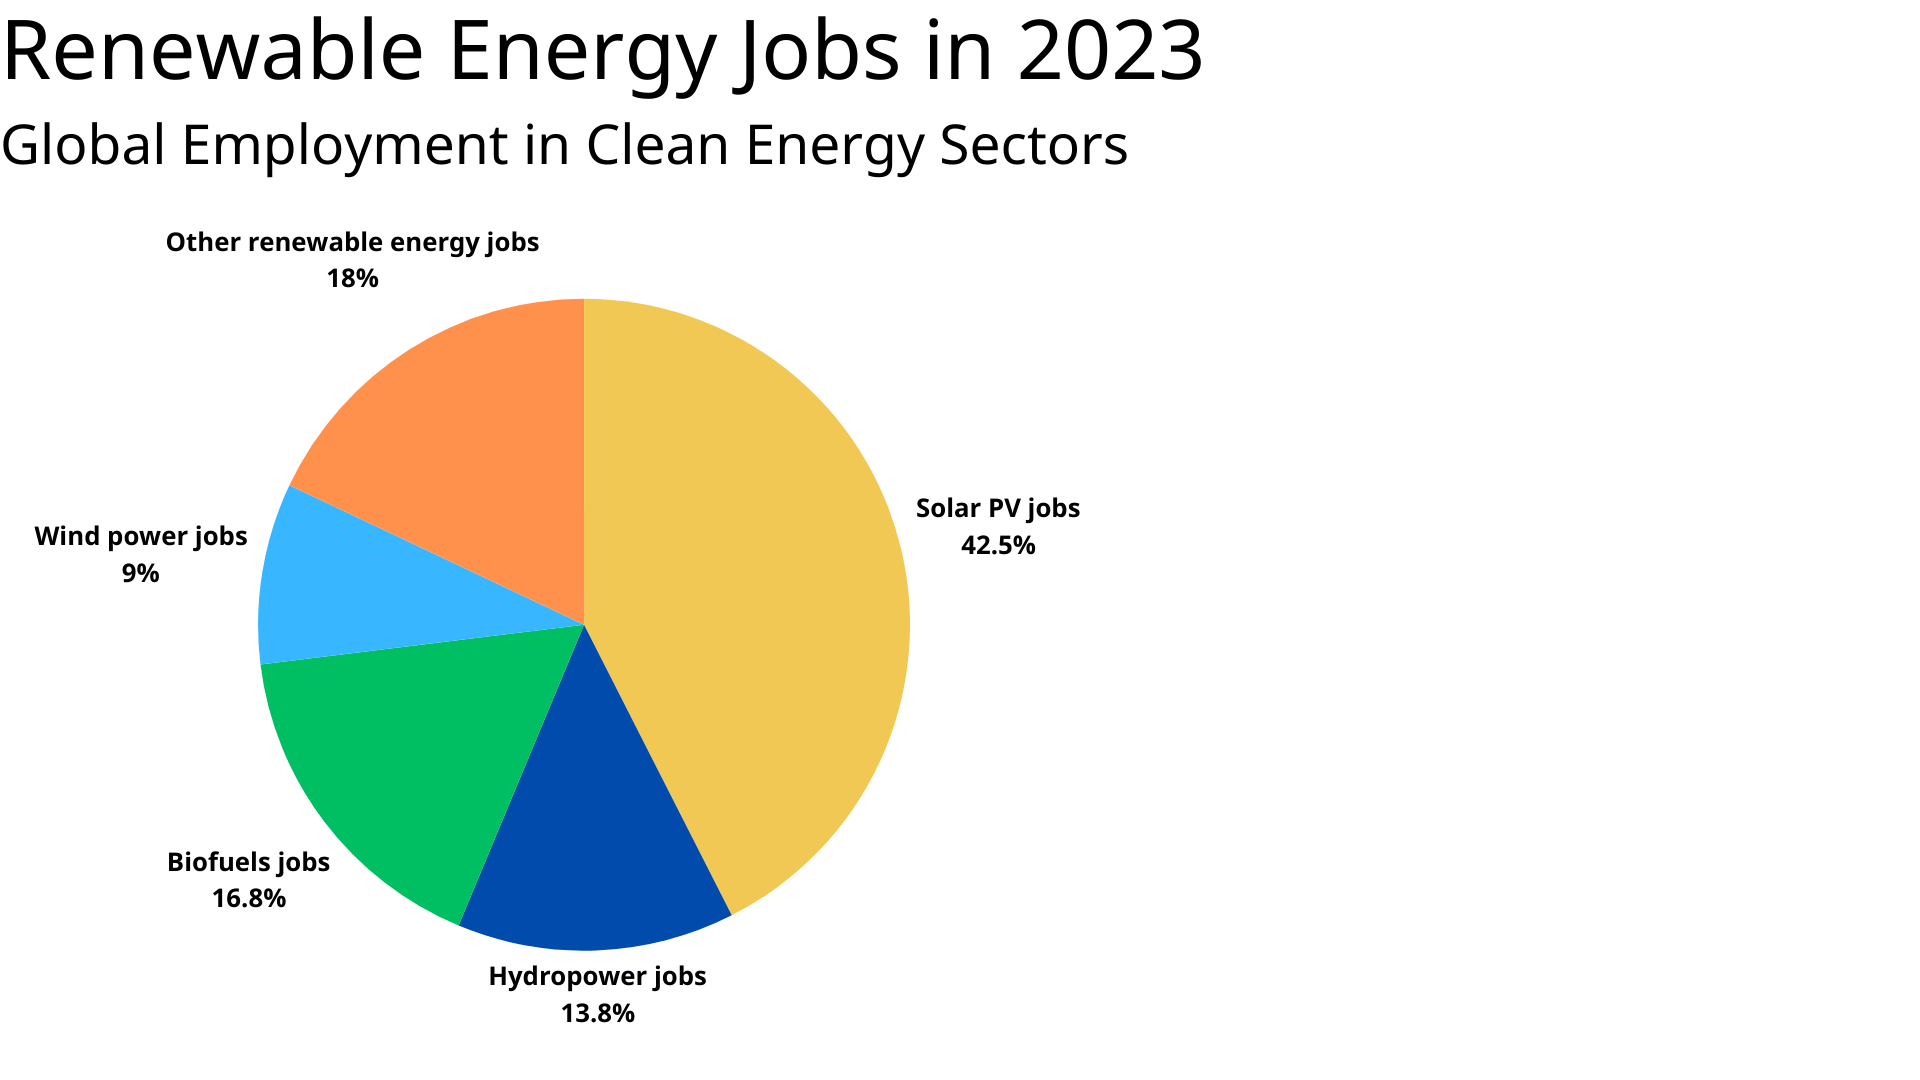 ▲ Fig 4 - Renewable Energy Jobs in 2023. Source: IRENA
Looking Ahead
Forecasts suggest that global renewable capacity could grow by 2.7 times by 2030 relative to 2023 levels, surpassing many national targets by about 25%—yet still falling short of the ideal ‘tripling’ scenario needed for a robust net-zero trajectory. Solar PV remains the prime candidate to drive this growth, although offshore wind is expected to see notable gains in regions with strong coastal infrastructure.
Ready to explore career opportunities in renewable energy? Discover open positions in solar, wind, and other fast-growing sectors.
References
- IEA, Renewables 2024
- IEA, Energy System – Renewables
- IRENA, Renewable Energy and Jobs – Annual Review 2024
- IRENA, Renewable Energy Statistics 2024
Article by Jaroslav Holub · Edited by the Rejobs Editorial Team
Published on February 11, 2025
Share this blog post with anyone who might be looking for a career in renewable energy.